Market Outlook
April 7, 2017
Market Cues
Domestic Indices
Chg (%)
(Pts)
(Close)
Indian markets are likely to open flat tracking the SGX Nifty & global cues.
BSE Sensex
(0.2)
(47)
29,927
US markets closed off intraday highs Thursday as President Donald Trump hosted
Nifty
(0.0)
(3)
9,262
his Chinese counterpart Xi Jinping for their first official meeting, as investors sought
Mid Cap
0.1
21
14,277
clues to how the leaders of the world’s economic powerhouses will tackle trade and
Small Cap
(0.2)
(34)
14,751
geopolitical issues. The mood in the market, however, remained cautious as
investors awaited nonfarm-payrolls data due on Friday. The S&P 500 index rose
Bankex
(0.2)
(52)
24,659
0.2%, to close at 2,357 while Nasdaq Composite Index climbed 0.3%, to end at
5,879.
Global Indices
Chg (%)
(Pts)
(Close)
The UK markets edged down after Federal Reserve indicated to start reducing its
Dow Jones
0.1
15
20,663
buildup of government and mortgage-backed bonds that has been a pillar of
Nasdaq
0.3
14
5,879
support for equity markets worldwide. The FTSE 100 fell 0.4% to close at 7,303.
FTSE
(0.4)
(28)
7,303
Nikkei
(1.4)
(264)
18,597
Benchmark indices pared losses to end the day on a flat note after the Reserve Bank
of India decided to keep the repo rate unchanged at 6.25% in line with the market
Hang Seng
(0.5)
(127)
24,274
expectations. The S&P BSE Sensex settled the day at 29,927, down 47 points, while
Shanghai Com
0.3
11
3,281
the broader Nifty50 ended at 9,262 down 3 points.
Advances / Declines
BSE
NSE
News Analysis
Advances
1,481
785
RBI in a pause mode
Declines
1,430
888
Detailed analysis on Pg2
Unchanged
128
56
Investor’s Ready Reckoner
Key Domestic & Global Indicators
Volumes (` Cr)
Stock Watch: Latest investment recommendations on 150+ stocks
BSE
4,391
Refer Pg5 onwards
NSE
25,422
Top Picks
CMP
Target
Upside
Net Inflows (` Cr)
Net
Mtd
Ytd
Company
Sector
Rating
(`)
(`)
(%)
FII
584
584
44,805
Amara Raja Batteries Auto & Auto AncillaryAccumulate
902
1,009
11.9
MFs
196
196
9,634
HCL Tech
IT
Buy
852
1,000
17.4
Power Grid Corp.
Power
Accumulate
197
223
13.1
Navkar Corp.
Others
Buy
208
265
27.2
Top Gainers
Price (`)
Chg (%)
KEI Industries
Others
Accumulate
194
207
6.6
Navkarcorp
208
15.1
More Top Picks on Pg3
Mcleodruss
180
7.4
Key Upcoming Events
Jindalstel
133
6.8
Previous
Consensus
Date
Region
Event Description
Adanitrans
76
6.3
Reading
Expectations
Apr 07, 2017 UK
Industrial Production (YoY)
3.20
3.70
Adanipower
44
5.2
Apr 07, 2017 India
Imports YoY%
21.76
Apr 07, 2017 US
Change in Nonfarm payrolls
235.00
180.00
Top Losers
Price (`)
Chg (%)
Apr 10, 2017 US
Unemployment rate
4.70
4.70
Deltacorp
185
(8.7)
Apr 10, 2017 India
Exports YoY%
17.48
Justdial
534
(3.9)
Apr 11, 2017 UK
CPI (YoY)
2.30
More Events on Pg4
Muthootfin
381
(3.8)
Corpbank
53
(3.7)
Gsfc
122
(3.5)
As on April 06, 2017
Market Outlook
April 7, 2017
News Analysis
RBI in a pause mode
As on expected line, the RBI dished out a HOLD on the repo rate at 6.25% though
it raised reverse repo rate by 25bps to 6%. It has also bought down the MSF rate
(Base rate) by 25bps to 6.50%. The reverse repo hike is aimed at draining out
excess liquidity which had piled up in the banking system post the demonetisation
saga. The raising of reverse repo should be constructed to be marginally positive
for Banks as they can park the excess liquidity at their behest and earn the
additional 0.25% interest from RBI. With this move, RBI has narrowed the policy
rate corridor to 50bps with the sole intention of managing the excess liquidity glut.
RBI has given its guidance towards the growth outlook for the economy and
expects GVA to bounce back to 7.4% in FY18 from 6.7% in FY17.
RBI also permitted Banks to invest in REIT’s and InvIT’s and though further clarity is
sought on the mechanism in which this shall be adopted, it can still be
sentimentally positive for listed realty and infrastructure players. The other
concerning point for RBI is the stickiness in core inflation and believes the shift to
‘neutral’ from ‘accommodative’ stance undertaken in the February policy was with
the premise of inflation remaining at elevated levels with the added risk of a
weaker monsoon outlook for the coming fiscal. RBI is of the belief that CPI inflation
can hover around 4.5% in the first half of this fiscal and around 5% in the second
half of the current financial year.
With this policy move, RBI in our opinion shall monitor further data-points on credit
growth, Inflationary numbers, panning out of monsoons, Bad asset resolution for
the banking industry, Federal reserve actions and general global macro economic
trends before they take a move in either direction on the rate front.
Economic and Political News
Banks can invest in REITs; Realty index at fresh 52-week high post RBI move
Services sector expands for a second straight month in March
Last-minute hiccups in way as GST roll-out deadline nears
Corporate News
Tata Motors receives order for 500 buses from Ivory Coast
Coal India actively looking to invest in coal assets in Australia
Essar Power's generation up 49% in 2016-17
Market Outlook
April 7, 2017
Top Picks ★★★★★
Large Cap
Market Cap
CMP
Target
Upside
Company
Rationale
(` Cr)
(`)
(`)
(%)
To outpace battery industry growth due to better technological
Amara Raja Batteries
15,400
902
1,009
11.9
products leading to market share gains in both the
automotive OEM and replacement segments.
The stock is trading at attractive valuations and is factoring all
HCL Tech
1,20,208
852
1,000
17.4
the bad news.
Back on the growth trend, expect a long term growth of 14%
Infosys
2,29,499
999
1,249
25.0
to be a US$20bn in FY2020.
One of the largest pharma companies with strong
Lupin
65,395
1,448
1,809
24.9
international presence. It has a rich pipeline of ANDAs which
is also one of the largest among the generic companies.
Going forward, we expect the company to report strong top-
Power Grid Corporation
1,03,167
197
223
13.1
line CAGR of ~16% and bottom-line CAGR of ~19% over
FY16-18 on back of strong capitalization guidance
Source: Company, AngelResearch
Mid Cap
Market Cap
CMP
Target
Upside
Company
Rationale
(` Cr)
(`)
(`)
(%)
We expect the company would report strong profitability
Asian Granito
1,119
372
390
4.9
owing to better product mix, higher B2C sales and
amalgamation synergy.
Among the top 4 players in the consumer durables segment.
Bajaj Electricals
3,566
352
395
12.2
Improved profitability backed by turn around in E&P segment.
Strong order book lends earnings visibility.
Favourable outlook for the AC industry to augur well for
Cooling products business which is out pacing the market
Blue Star
6,562
687
760
10.7
growth. EMPPAC division's profitability to improve once
operating environment turns around.
Strong loan growth backed by diversified loan portfolio and
Equitas Holdings
5,690
168
235
39.5
adequate CAR. ROE & ROA likely to remain decent as risk of
dilution remains low. Attractive valuations considering growth.
Economic recovery to have favourable impact on advertising
& circulation revenue growth. Further, the acquisition of a
Jagran Prakashan
6,107
187
225
20.4
radio business (Radio City) would also boost the company's
revenue growth.
High order book execution in EPC segment, rising B2C sales
KEI Industries
1,510
194
207
6.6
and higher exports to boost the revenues and profitability
Speedier execution and speedier sales, strong revenue
Mahindra Lifespace
1,676
408
522
27.8
visibility in short-to-long run, attractive valuations
Higher growth in domestic branded sales and healthy export
Mirza International
1,066
89
107
20.8
to boost the profitability.
Massive capacity expansion along with rail advantage at ICD
Navkar Corporation
2,972
208
265
27.2
as well CFS augurs well for the company
Strong brands and distribution network would boost growth
Siyaram Silk Mills
1,603
1,710
1,872
9.5
going ahead. Stock currently trades at an inexpensive
valuation.
Market leadership in Hindi news genre and no. 2 viewership
ranking in English news genre, exit from the radio business,
TV Today Network
1,706
286
344
20.3
and anticipated growth in ad spends by corporates to benefit
the stock.
Source: Company, Angel Research
Market Outlook
April 7, 2017
Key Upcoming Events
Global economic events release calendar
Bloomberg Data
Date
Time
Country
Event Description
Unit
Period
Last Reported
Estimated
Apr 07, 2017
2:00 PM UK
Industrial Production (YoY)
% Change
Feb
3.20
3.70
India
Imports YoY%
% Change
Mar
21.76
6:00 PM US
Change in Nonfarm payrolls
Thousands
Mar
235.00
180.00
Apr 10, 2017
6:00 PM US
Unemployment rate
%
Mar
4.70
4.70
India
Exports YoY%
% Change
Mar
17.48
Apr 11, 2017
2:00 PM UK
CPI (YoY)
% Change
Mar
2.30
Apr 12, 2017
2:00 PM UK
Jobless claims change
% Change
Mar
-11.30
5:30 PM India
Industrial Production YoY
% Change
Feb
2.70
7:00 AM China
Consumer Price Index (YoY)
% Change
Mar
0.80
1.00
Apr 13, 2017
US
Producer Price Index (mom)
% Change
Mar
0.10
China
Exports YoY%
% Change
Mar
-1.30
4.00
Apr 14, 2017
6:00 PM US
Consumer price index (mom)
% Change
Mar
0.10
0.00
Apr 17, 2017
12:00 PM India
Monthly Wholesale Prices YoY%
% Change
Mar
6.55
7:30 AM China
Real GDP (YoY)
% Change
1Q
6.80
6.80
7:30 AM China
Industrial Production (YoY)
% Change
Mar
6.00
6.30
Apr 18, 2017
6:00 PM US
Housing Starts
Thousands
Mar
1288.00
1280.00
6:00 PM US
Building permits
Thousands
Mar
1216.00
1260.00
6:45 PM US
Industrial Production
%
Mar
0.11
0.50
Apr 19, 2017
2:30 PM Euro Zone Euro-Zone CPI (YoY)
%
Mar F
1.50
Apr 20, 2017
7:30 PM Euro Zone Euro-Zone Consumer Confidence
Value
Apr A
(5.00)
Apr 21, 2017
1:00 PM Germany PMI Services
Value
Apr P
55.60
1:00 PM Germany PMI Manufacturing
Value
Apr P
58.30
7:30 PM US
Existing home sales
Million
Mar
5.48
5.55
Apr 25, 2017
7:30 PM US
New home sales
Thousands
Mar
592.00
590.00
5:15 PM Euro Zone ECB announces interest rates
%
Apr 27
-
Source: Bloomberg, Angel Research
Market Outlook
April 7, 2017
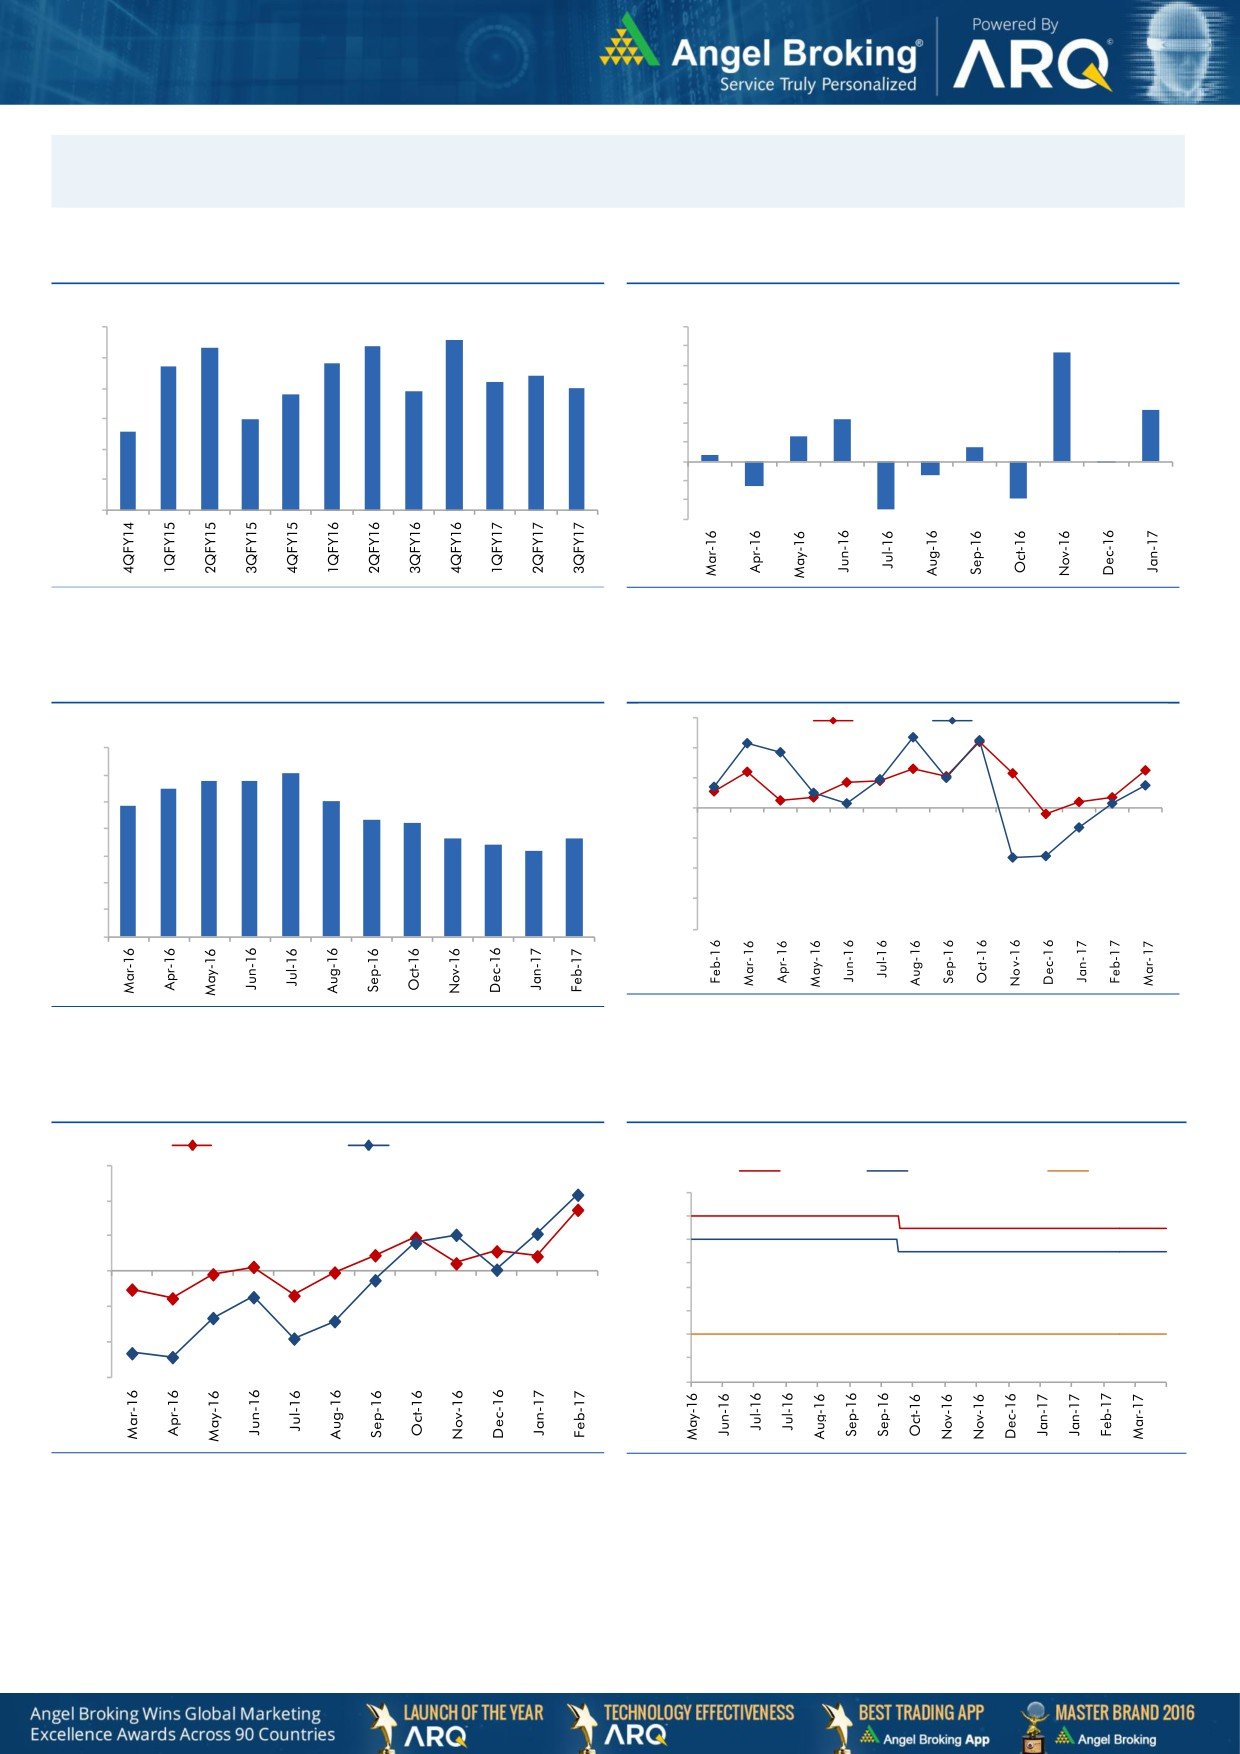
Macro watch
Exhibit 1: Quarterly GDP trends
Exhibit 2: IIP trends
(%)
(%)
8.6
9.0
8.4
7.0
8.3
5.7
7.7
7.8
6.0
8.0
7.4
7.2
5.0
6.9
7.0
6.8
7.0
4.0
2.7
6.0
3.0
2.2
6.0
5.6
1.3
2.0
0.7
1.0
0.3
5.0
-
4.0
(1.0)
(0.1)
(0.7)
(2.0)
3.0
(1.3)
(3.0)
(1.9)
(2.5)
Source: CSO, Angel Research
Source: MOSPI, Angel Research
Exhibit 3: Monthly CPI inflation trends
Exhibit 4: Manufacturing and services PMI
56.0
Mfg. PMI
Services PMI
(%)
7.0
54.0
6.1
5.8
5.8
6.0
5.5
52.0
5.1
4.8
5.0
4.3
4.2
50.0
3.6
3.7
4.0
3.4
3.2
48.0
3.0
46.0
2.0
44.0
1.0
42.0
-
Source: Market, Angel Research; Note: Level above 50 indicates expansion
Source: MOSPI, Angel Research
Exhibit 5: Exports and imports growth trends
Exhibit 6: Key policy rates
(%)
Exports yoy growth
Imports yoy growth
D
30.0
(%)
Repo rate
Reverse Repo rate
CRR
7.00
20.0
6.50
10.0
6.00
5.50
0.0
5.00
(10.0)
4.50
4.00
(20.0)
3.50
(30.0)
3.00
Source: Bloomberg, Angel Research
Source: RBI, Angel Research
Market Outlook
April 7, 2017
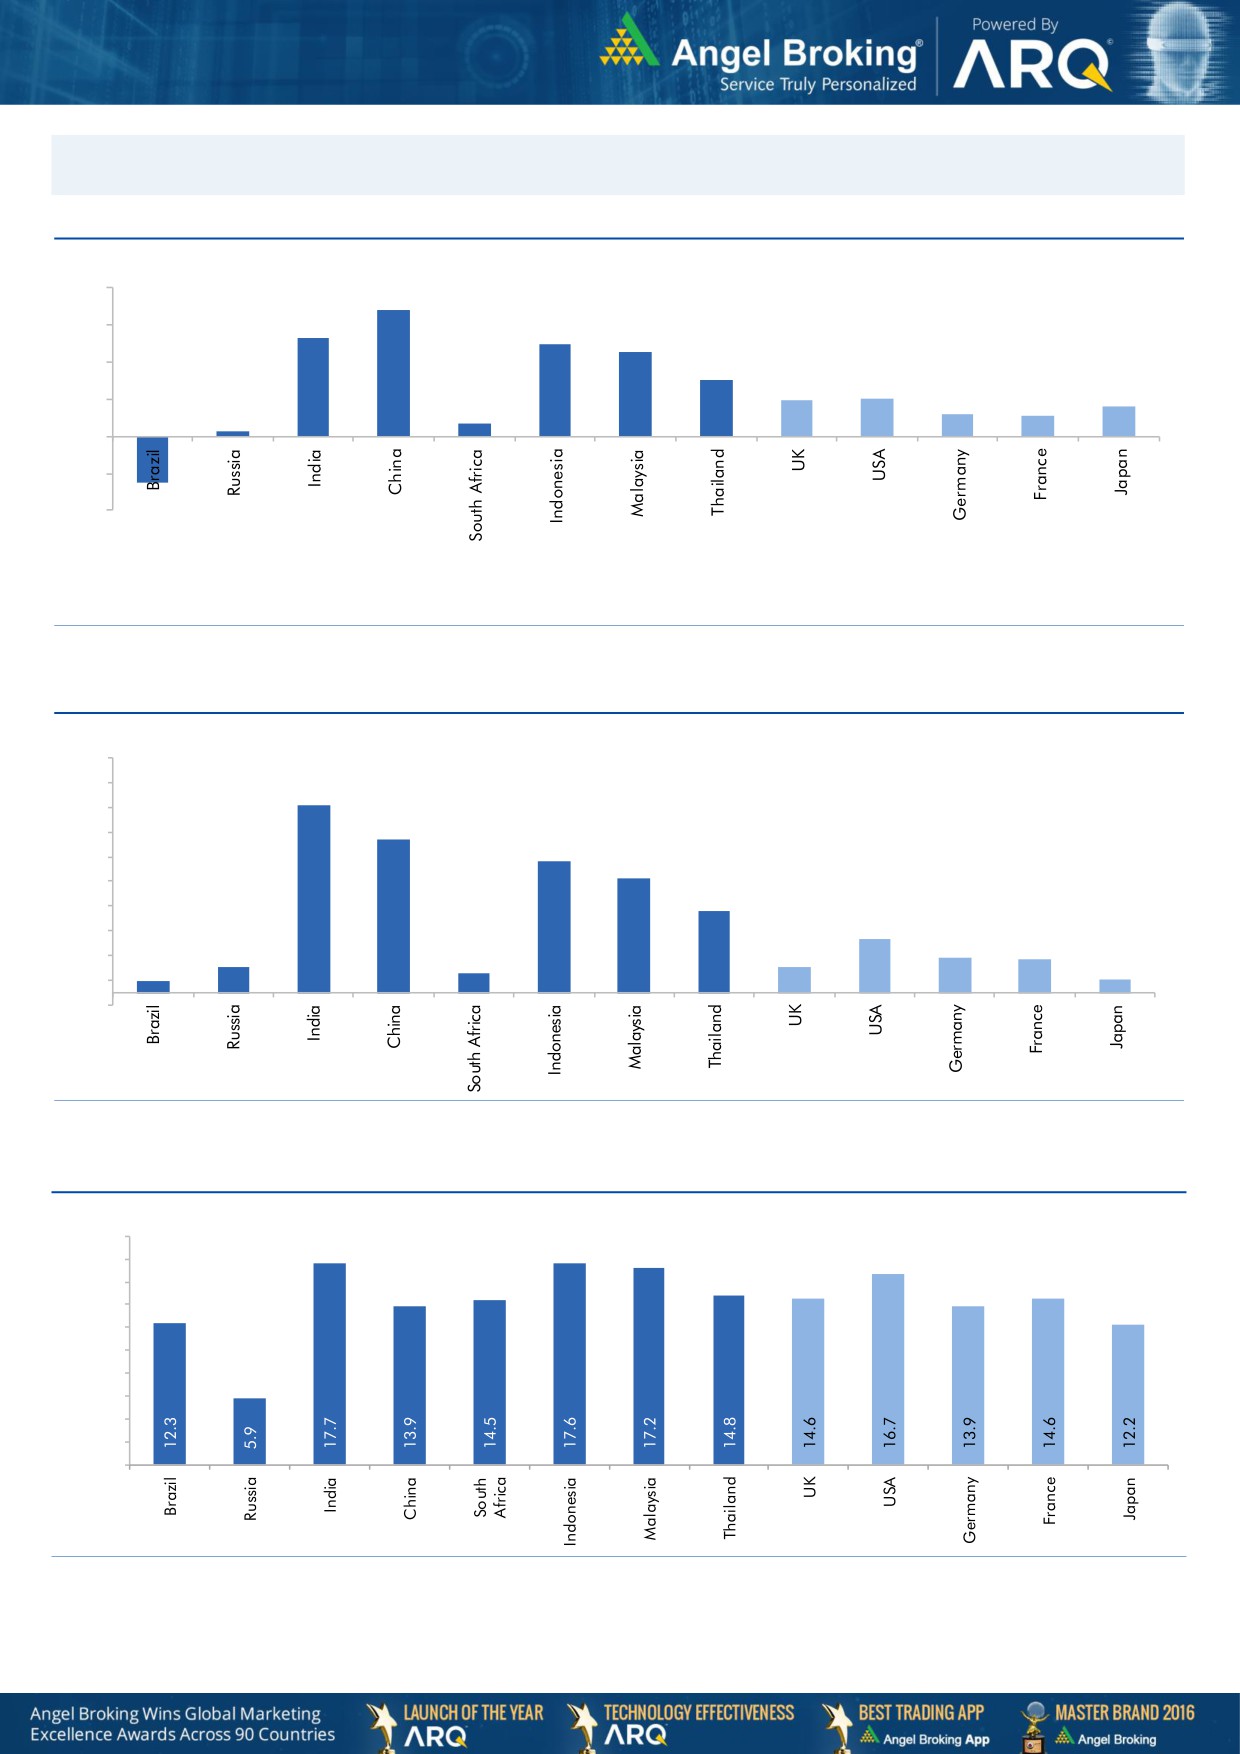
Global watch
Exhibit 1: Latest quarterly GDP Growth (%, yoy) across select developing and developed countries
(%)
8.0
6.8
0.7
5.3
6.0
4.9
4.5
4.0
3.0
0.3
1.9
2.0
1.2
1.6
1.1
2.0
-
(2.0)
(2.5)
(4.0)
Source: Bloomberg, Angel Research
Exhibit 2: 2017 GDP Growth projection by IMF (%, yoy) across select developing and developed countries
(%)
9.5
8.5
7.6
7.5
6.2
6.5
5.3
5.5
4.6
4.5
3.3
3.5
2.2
2.5
1.1
1.4
1.3
1.1
1.5
0.5
0.8
0.6
0.5
(0.5)
Source: IMF, Angel Research
Exhibit 3: One year forward P-E ratio across select developing and developed countries
(x)
20.0
18.0
16.0
14.0
12.0
10.0
8.0
6.0
4.0
2.0
-
Source: IMF, Angel Research
Market Outlook
April 7, 2017
Exhibit 4: Relative performance of indices across globe
Returns (%)
Country
Name of index
Closing price
1M
3M
1YR
Brazil
Bovespa
64,775
(2.4)
8.7
32.0
Russia
Micex
2,056
0.4
(9.2)
9.5
India
Nifty
9,265
4.1
13.2
19.7
China
Shanghai Composite
3,270
1.9
5.3
10.8
South Africa
Top 40
46,150
3.6
5.3
2.1
Mexico
Mexbol
49,208
3.8
6.7
9.9
Indonesia
LQ45
944
5.2
5.9
12.4
Malaysia
KLCI
1,745
1.0
6.3
1.6
Thailand
SET 50
1,000
2.5
2.0
10.2
USA
Dow Jones
20,648
(1.5)
3.9
17.7
UK
FTSE
7,332
(0.3)
1.9
18.3
Japan
Nikkei
18,861
(3.1)
(1.3)
10.1
Germany
DAX
12,218
1.9
5.1
21.3
France
CAC
5,092
2.9
3.8
11.7
Source: Bloomberg, Angel Research
Stock Watch
April 07, 2017
Company Name
Reco
CMP
Target
Mkt Cap
Sales ( Čcr )
OPM(%)
EPS (Č)
PER(x)
P/BV(x)
RoE(%)
EV/Sales(x)
(Č)
Price ( Č)
( Č cr )
FY17E
FY18E
FY17E
FY18E
FY17E
FY18E
FY17E
FY18E
FY17E
FY18E
FY17E
FY18E
FY17E
FY18E
6,577.0
6,907.0
Agri / Agri Chemical
Rallis
Neutral
253
-
4,919
1,937
2,164
13.3
14.3
9.0
11.0
28.1
23.0
4.9
4.3
18.4
19.8
2.6
2.3
United Phosphorus
Neutral
730
-
36,987
15,176
17,604
18.5
18.5
37.4
44.6
19.5
16.4
3.8
3.2
21.4
21.2
2.5
2.2
Auto & Auto Ancillary
Ashok Leyland
Buy
84
111
24,019
20,021
21,915
11.6
11.9
4.5
5.3
18.8
15.9
3.8
3.4
20.6
21.5
1.1
1.0
Bajaj Auto
Neutral
2,801
-
81,052
25,093
27,891
19.5
19.2
143.9
162.5
19.5
17.2
5.5
4.7
30.3
29.4
3.0
2.6
Bharat Forge
Neutral
1,089
-
25,350
7,726
8,713
20.5
21.2
35.3
42.7
30.9
25.5
5.7
5.2
18.9
20.1
3.3
2.9
Eicher Motors
Neutral
25,596
-
69,648
16,583
20,447
17.5
18.0
598.0
745.2
42.8
34.4
14.6
11.1
41.2
38.3
4.0
3.2
Gabriel India
Neutral
126
-
1,806
1,544
1,715
9.0
9.3
5.4
6.3
23.3
20.0
4.4
3.9
18.9
19.5
1.1
1.0
Hero Motocorp
Accumulate
3,205
3,446
64,010
28,083
30,096
15.3
15.7
171.8
187.0
18.7
17.1
6.5
5.5
30.1
27.9
2.1
1.9
Jamna Auto Industries Neutral
224
-
1,781
1,486
1,620
9.8
9.9
15.0
17.2
14.9
13.0
3.3
2.8
21.8
21.3
1.3
1.1
L G Balakrishnan & Bros Neutral
626
-
983
1,302
1,432
11.6
11.9
43.7
53.0
14.3
11.8
2.0
1.8
13.8
14.2
0.8
0.8
Mahindra and Mahindra Neutral
1,288
-
80,022
46,534
53,077
11.6
11.7
67.3
78.1
19.1
16.5
3.1
2.7
15.4
15.8
1.7
1.5
Maruti
Neutral
6,285
-
189,868
67,822
83,288
16.0
16.4
253.8
312.4
24.8
20.1
5.7
4.6
23.0
22.9
2.5
1.9
Minda Industries
Neutral
445
-
3,528
2,728
3,042
9.0
9.1
68.2
86.2
6.5
5.2
1.5
1.2
23.8
24.3
1.4
1.2
Motherson Sumi
Neutral
383
-
53,785
45,896
53,687
7.8
8.3
13.0
16.1
29.4
23.8
9.5
7.6
34.7
35.4
1.2
1.0
Rane Brake Lining
Neutral
1,020
-
807
511
562
11.3
11.5
28.1
30.9
36.3
33.0
5.5
5.0
15.3
15.0
1.7
1.6
Setco Automotive
Neutral
38
-
508
741
837
13.0
13.0
15.2
17.0
2.5
2.2
0.4
0.4
15.8
16.3
1.1
1.0
Tata Motors
Neutral
473
-
136,586
300,209
338,549
8.9
8.4
42.7
54.3
11.1
8.7
1.8
1.5
15.6
17.2
0.6
0.5
TVS Motor
Neutral
450
-
21,365
13,390
15,948
6.9
7.1
12.8
16.5
35.2
27.2
8.8
6.9
26.3
27.2
1.6
1.4
Amara Raja Batteries
Accumulate
902
1,009
15,400
5,305
6,100
16.0
16.3
28.4
34.0
31.8
26.5
6.1
5.1
19.3
19.3
2.9
2.5
Exide Industries
Neutral
228
-
19,338
7,439
8,307
15.0
15.0
8.1
9.3
28.1
24.5
3.9
3.5
14.3
16.7
2.2
2.0
Apollo Tyres
Accumulate
213
235
10,852
12,877
14,504
14.3
13.9
21.4
23.0
10.0
9.3
1.6
1.3
16.4
15.2
1.0
0.9
Ceat
Neutral
1,381
-
5,588
7,524
8,624
13.0
12.7
131.1
144.3
10.5
9.6
1.9
1.6
19.8
18.6
0.8
0.7
JK Tyres
Neutral
133
-
3,020
7,455
8,056
15.0
15.0
21.8
24.5
6.1
5.4
1.3
1.0
22.8
21.3
0.5
0.4
Swaraj Engines
Neutral
1,480
-
1,838
660
810
15.2
16.4
54.5
72.8
27.2
20.3
8.5
7.7
31.5
39.2
2.6
2.1
Subros
Neutral
221
-
1,327
1,488
1,681
11.7
11.9
6.4
7.2
34.6
30.9
3.7
3.3
10.8
11.4
1.1
1.0
Indag Rubber
Neutral
212
-
557
286
326
19.8
16.8
11.7
13.3
18.2
15.9
3.1
2.9
17.8
17.1
1.6
1.4
Capital Goods
ACE
Neutral
68
-
671
709
814
4.1
4.6
1.4
2.1
48.4
32.3
2.0
1.9
4.4
6.0
1.1
1.0
Stock Watch
April 07, 2017
Company Name
Reco
CMP
Target
Mkt Cap
Sales ( Čcr )
OPM(%)
EPS (Č)
PER(x)
P/BV(x)
RoE(%)
EV/Sales(x)
(Č)
Price ( Č)
( Č cr )
FY17E
FY18E
FY17E
FY18E
FY17E
FY18E
FY17E
FY18E
FY17E
FY18E
FY17E
FY18E
FY17E
FY18E
Capital Goods
BEML
Neutral
1,388
-
5,781
3,451
4,055
6.3
9.2
31.4
57.9
44.2
24.0
2.7
2.4
6.3
10.9
1.8
1.5
Bharat Electronics
Neutral
166
-
36,967
8,137
9,169
16.8
17.2
58.7
62.5
2.8
2.7
0.4
0.4
44.6
46.3
3.5
3.2
Voltas
Neutral
413
-
13,662
6,511
7,514
7.9
8.7
12.9
16.3
32.0
25.3
5.8
5.1
16.7
18.5
1.9
1.6
BGR Energy
Neutral
153
-
1,105
16,567
33,848
6.0
5.6
7.8
5.9
19.6
26.0
1.1
1.1
4.7
4.2
0.2
0.1
BHEL
Neutral
179
-
43,739
28,797
34,742
-
2.8
2.3
6.9
77.7
25.9
1.3
1.3
1.3
4.8
1.2
0.9
Blue Star
Accumulate
687
760
6,562
4,283
5,077
5.9
7.3
14.9
22.1
46.1
31.0
9.0
7.6
20.4
26.4
1.6
1.3
CG Power and Industrial
Neutral
80
-
4,992
5,777
6,120
5.9
7.0
3.3
4.5
24.1
17.7
1.1
1.0
4.4
5.9
0.8
0.7
Solutions
Greaves Cotton
Neutral
170
-
4,147
1,755
1,881
16.8
16.9
7.8
8.5
21.8
20.0
4.4
4.0
20.6
20.9
2.1
1.9
Inox Wind
Neutral
182
-
4,038
5,605
6,267
15.7
16.4
24.8
30.0
7.3
6.1
2.0
1.5
25.9
24.4
0.8
0.6
KEC International
Neutral
218
-
5,602
9,294
10,186
7.9
8.1
9.9
11.9
22.0
18.3
3.2
2.8
15.6
16.3
0.8
0.8
KEI Industries
Accumulate
194
207
1,510
2,682
3,058
10.4
10.0
11.7
12.8
16.5
15.2
3.3
2.8
20.1
18.2
0.8
0.7
Thermax
Neutral
988
-
11,769
5,421
5,940
7.3
7.3
25.7
30.2
38.4
32.7
4.7
4.3
12.2
13.1
2.1
1.9
VATech Wabag
Neutral
702
-
3,833
3,136
3,845
8.9
9.1
26.0
35.9
27.0
19.6
3.4
2.9
13.4
15.9
1.1
0.9
Cement
ACC
Neutral
1,487
-
27,915
11,225
13,172
13.2
16.9
44.5
75.5
33.4
19.7
3.2
2.9
11.2
14.2
2.5
2.1
Ambuja Cements
Neutral
243
-
48,241
9,350
10,979
18.2
22.5
5.8
9.5
41.9
25.6
3.5
3.2
10.2
12.5
5.2
4.4
India Cements
Neutral
165
-
5,056
4,364
4,997
18.5
19.2
7.9
11.3
20.8
14.6
1.5
1.5
8.0
8.5
1.9
1.7
JK Cement
Neutral
932
-
6,515
4,398
5,173
15.5
17.5
31.2
55.5
29.9
16.8
3.6
3.1
12.0
15.5
2.0
1.7
J K Lakshmi Cement
Neutral
454
-
5,343
2,913
3,412
14.5
19.5
7.5
22.5
60.5
20.2
3.7
3.1
12.5
18.0
2.4
2.0
Orient Cement
Neutral
145
-
2,976
2,114
2,558
18.5
20.5
8.1
11.3
17.9
12.9
2.6
2.2
9.0
14.0
2.0
1.6
UltraTech Cement
Neutral
4,109
-
112,791
25,768
30,385
21.0
23.5
111.0
160.0
37.0
25.7
4.7
4.1
13.5
15.8
4.5
3.7
Construction
ITNL
Neutral
114
-
3,749
8,946
10,017
31.0
31.6
8.1
9.1
14.1
12.5
0.5
0.5
4.2
5.0
3.8
3.5
KNR Constructions
Neutral
196
-
2,753
1,385
1,673
14.7
14.0
41.2
48.5
4.8
4.0
0.9
0.8
14.9
15.2
2.1
1.7
Larsen & Toubro
Neutral
1,683
-
156,985
111,017
124,908
11.0
11.0
61.1
66.7
27.5
25.2
3.3
3.1
13.1
12.9
2.5
2.3
Gujarat Pipavav Port
Neutral
166
-
8,047
705
788
52.2
51.7
5.0
5.6
33.3
29.7
3.3
3.0
11.2
11.2
11.1
9.4
Nagarjuna Const.
Neutral
87
-
4,842
8,842
9,775
9.1
8.8
5.3
6.4
16.4
13.6
1.3
1.2
8.2
9.1
0.7
0.6
PNC Infratech
Accumulate
127
143
3,247
2,350
2,904
13.1
13.2
9.0
8.8
14.1
14.4
0.5
0.5
15.9
13.9
1.5
1.2
Simplex Infra
Neutral
318
-
1,571
6,829
7,954
10.5
10.5
31.4
37.4
10.1
8.5
1.1
1.0
9.9
13.4
0.7
0.6
Power Mech Projects
Neutral
540
-
794
1,801
2,219
12.7
14.6
72.1
113.9
7.5
4.7
1.4
1.2
16.8
11.9
0.4
0.3
Sadbhav Engineering
Neutral
309
-
5,296
3,598
4,140
10.3
10.6
9.0
11.9
34.3
25.9
3.6
3.2
9.9
11.9
1.8
1.5
Stock Watch
April 07, 2017
Company Name
Reco
CMP
Target
Mkt Cap
Sales ( Čcr )
OPM(%)
EPS (Č)
PER(x)
P/BV(x)
RoE(%)
EV/Sales(x)
(Č)
Price ( Č)
( Č cr )
FY17E
FY18E
FY17E
FY18E
FY17E
FY18E
FY17E
FY18E
FY17E
FY18E
FY17E
FY18E
FY17E
FY18E
Construction
NBCC
Neutral
173
-
15,575
7,428
9,549
7.9
8.6
8.2
11.0
21.1
15.7
1.1
0.8
28.2
28.7
1.8
1.3
MEP Infra
Neutral
61
-
998
1,877
1,943
30.6
29.8
3.0
4.2
20.5
14.6
9.9
6.7
0.6
0.6
1.9
1.7
SIPL
Neutral
100
-
3,538
1,036
1,252
65.5
66.2
(8.4)
(5.6)
3.8
4.3
(22.8)
(15.9)
11.6
9.7
Engineers India
Neutral
151
-
10,162
1,725
1,935
16.0
19.1
11.4
13.9
13.2
10.9
1.8
1.8
13.4
15.3
4.8
4.3
Financials
Axis Bank
Accumulate
509
580
121,820
46,932
53,575
3.5
3.4
32.4
44.6
15.7
11.4
2.0
1.8
13.6
16.5
-
-
Bank of Baroda
Neutral
174
-
40,127
19,980
23,178
1.8
1.8
11.5
17.3
15.1
10.1
1.7
1.4
8.3
10.1
-
-
Canara Bank
Neutral
310
-
16,833
15,225
16,836
1.8
1.8
14.5
28.0
21.4
11.1
1.5
1.2
5.8
8.5
-
-
Can Fin Homes
Neutral
2,350
-
6,257
420
526
3.5
3.5
86.5
107.8
27.2
21.8
5.9
4.8
23.6
24.1
-
-
Cholamandalam Inv. &
Buy
987
1,230
15,420
2,012
2,317
6.3
6.3
42.7
53.6
23.1
18.4
3.7
3.1
16.9
18.3
-
-
Fin. Co.
Dewan Housing Finance Buy
390
460
12,222
2,225
2,688
2.9
2.9
29.7
34.6
13.1
11.3
2.1
1.4
16.1
14.8
-
-
Equitas Holdings
Buy
168
235
5,690
939
1,281
11.7
11.5
5.8
8.2
29.0
20.5
2.5
2.2
10.9
11.5
-
-
Federal Bank
Neutral
89
-
15,318
8,259
8,995
3.0
3.0
4.3
5.6
20.7
15.9
1.8
1.6
8.5
10.1
-
-
HDFC
Neutral
1,484
-
235,830
11,475
13,450
3.4
3.4
45.3
52.5
32.8
28.3
6.3
5.6
20.2
20.5
-
-
HDFC Bank
Neutral
1,436
-
367,956
46,097
55,433
4.5
4.5
58.4
68.0
24.6
21.1
4.3
3.6
18.8
18.6
-
-
ICICI Bank
Accumulate
281
315
163,580
42,800
44,686
3.1
3.3
18.0
21.9
15.6
12.8
2.1
2.0
11.1
12.3
-
-
Karur Vysya Bank
Buy
115
140
6,971
5,640
6,030
3.3
3.2
8.9
10.0
13.0
11.5
1.4
1.3
11.2
11.4
-
-
Lakshmi Vilas Bank
Neutral
171
-
3,267
3,339
3,799
2.7
2.8
11.0
14.0
15.5
12.2
1.6
1.5
11.2
12.7
-
-
LIC Housing Finance
Neutral
625
-
31,521
3,712
4,293
2.6
2.5
39.0
46.0
16.0
13.6
3.0
2.6
19.9
20.1
-
-
Punjab Natl.Bank
Neutral
151
-
32,186
23,532
23,595
2.3
2.4
6.8
12.6
22.2
12.0
3.4
2.4
3.3
6.5
-
-
RBL Bank
Neutral
547
-
20,232
1,783
2,309
2.6
2.6
12.7
16.4
43.1
33.4
4.7
4.2
12.8
13.3
-
-
Repco Home Finance
Buy
715
825
4,476
388
457
4.5
4.2
30.0
38.0
23.9
18.8
4.0
3.3
18.0
19.2
-
-
South Ind.Bank
Neutral
21
-
3,867
6,435
7,578
2.5
2.5
2.7
3.1
7.9
6.9
1.0
0.9
10.1
11.2
-
-
St Bk of India
Neutral
293
-
233,384
88,650
98,335
2.6
2.6
13.5
18.8
21.7
15.6
2.1
1.8
7.0
8.5
-
-
Union Bank
Neutral
155
-
10,631
13,450
14,925
2.3
2.3
25.5
34.5
6.1
4.5
0.9
0.8
7.5
10.2
-
-
Yes Bank
Neutral
1,565
-
71,422
8,978
11,281
3.3
3.4
74.0
90.0
21.1
17.4
4.0
3.4
17.0
17.2
-
-
FMCG
Akzo Nobel India
Neutral
1,875
-
8,993
2,955
3,309
13.3
13.7
57.2
69.3
32.8
27.1
10.7
9.0
32.7
33.3
2.8
2.5
Asian Paints
Neutral
1,085
-
104,073
17,128
18,978
16.8
16.4
19.1
20.7
56.8
52.4
19.8
18.6
34.8
35.5
6.0
5.4
Britannia
Accumulate
3,354
3,626
40,246
9,594
11,011
14.6
14.9
80.3
94.0
41.8
35.7
17.2
13.3
41.2
-
4.1
3.5
Colgate
Neutral
1,005
-
27,347
4,605
5,149
23.4
23.4
23.8
26.9
42.3
37.4
23.4
18.3
64.8
66.8
5.9
5.2
Stock Watch
April 07, 2017
Company Name
Reco
CMP
Target
Mkt Cap
Sales ( Čcr )
OPM(%)
EPS (Č)
PER(x)
P/BV(x)
RoE(%)
EV/Sales(x)
(Č)
Price ( Č)
( Č cr )
FY17E FY18E
FY17E
FY18E
FY17E
FY18E
FY17E
FY18E
FY17E
FY18E
FY17E
FY18E
FY17E
FY18E
FMCG
Dabur India
Accumulate
285
304
50,124
8,315
9,405
19.8
20.7
8.1
9.2
35.1
30.9
9.8
8.1
31.6
31.0
5.7
5.0
GlaxoSmith Con*
Neutral
5,171
-
21,746
4,350
4,823
21.2
21.4
179.2
196.5
28.9
26.3
7.7
6.5
27.1
26.8
4.4
3.9
Godrej Consumer
Neutral
1,693
-
57,676
10,235
11,428
18.4
18.6
41.1
44.2
41.2
38.3
9.1
7.7
24.9
24.8
5.7
5.1
HUL
Neutral
934
-
202,107
35,252
38,495
17.8
17.8
20.7
22.4
45.2
41.7
43.2
37.1
95.6
88.9
5.6
5.1
ITC
Neutral
274
-
333,263
40,059
44,439
38.3
39.2
9.0
10.1
30.6
27.1
8.5
7.4
27.8
27.5
7.8
7.0
Marico
Neutral
299
-
38,553
6,430
7,349
18.8
19.5
6.4
7.7
46.7
38.8
14.1
11.9
33.2
32.5
5.8
5.0
Nestle*
Neutral
6,611
-
63,737
10,073
11,807
20.7
21.5
124.8
154.2
53.0
42.9
21.8
19.6
34.8
36.7
6.1
5.2
Tata Global
Neutral
153
-
9,659
8,675
9,088
9.8
9.8
7.4
8.2
20.7
18.7
1.6
1.6
7.9
8.1
1.0
1.0
Procter & Gamble
Neutral
7,370
-
23,924
2,939
3,342
23.2
23.0
146.2
163.7
50.4
45.0
12.8
10.6
25.3
23.5
7.7
6.7
Hygiene
IT
HCL Tech^
Buy
852
1,000
120,208
49,242
57,168
20.5
20.5
55.7
64.1
15.3
13.3
3.1
2.4
20.3
17.9
2.3
1.9
Infosys
Buy
999
1,249
229,499
68,350
77,326
27.0
27.0
62.5
69.4
16.0
14.4
3.4
3.1
21.3
21.6
2.8
2.4
TCS
Accumulate
2,400
2,700
472,853
119,025
133,308
27.6
27.6
131.2
145.5
18.3
16.5
5.9
5.5
32.4
33.1
3.8
3.3
Tech Mahindra
Buy
447
600
43,513
29,673
32,937
15.5
17.0
32.8
39.9
13.6
11.2
2.7
2.3
19.6
20.7
1.2
1.0
Wipro
Accumulate
513
583
124,802
55,440
60,430
18.1
18.1
36.1
38.9
14.2
13.2
2.6
2.4
19.0
17.6
2.0
1.7
Media
D B Corp
Neutral
394
-
7,244
2,297
2,590
27.4
28.2
21.0
23.4
18.8
16.8
4.4
3.8
23.7
23.1
3.0
2.5
HT Media
Neutral
85
-
1,967
2,693
2,991
12.6
12.9
7.9
9.0
10.7
9.4
0.9
0.8
7.8
8.3
0.3
0.2
Jagran Prakashan
Buy
187
225
6,107
2,355
2,635
28.0
28.0
10.8
12.5
17.3
15.0
3.8
3.2
21.7
21.7
2.6
2.3
Sun TV Network
Neutral
789
-
31,111
2,850
3,265
70.1
71.0
26.2
30.4
30.1
26.0
7.7
6.8
24.3
25.6
10.5
9.0
Hindustan Media
Neutral
289
-
2,122
1,016
1,138
24.3
25.2
27.3
30.1
10.6
9.6
2.0
1.8
16.2
15.8
1.4
1.2
Ventures
TV Today Network
Buy
286
344
1,706
567
645
26.7
27.0
15.4
18.1
18.6
15.8
2.8
2.4
14.9
15.2
2.6
2.2
Metals & Mining
Coal India
Neutral
287
-
177,935
84,638
94,297
21.4
22.3
24.5
27.1
11.7
10.6
4.9
4.6
42.6
46.0
1.6
1.4
Hind. Zinc
Neutral
288
-
121,795
14,252
18,465
55.9
48.3
15.8
21.5
18.2
13.4
3.0
2.6
17.0
20.7
8.6
6.6
Hindalco
Neutral
194
-
43,485
107,899
112,095
7.4
8.2
9.2
13.0
21.1
14.9
1.0
1.0
4.8
6.6
0.9
0.9
JSW Steel
Neutral
204
-
49,251
53,201
58,779
16.1
16.2
130.6
153.7
1.6
1.3
0.2
0.2
14.0
14.4
1.7
1.5
NMDC
Neutral
137
-
43,409
6,643
7,284
44.4
47.7
7.1
7.7
19.3
17.8
1.7
1.6
8.8
9.2
4.3
3.9
SAIL
Neutral
68
-
27,878
47,528
53,738
(0.7)
2.1
(1.9)
2.6
26.0
0.7
0.7
(1.6)
3.9
1.4
1.3
Vedanta
Neutral
270
-
80,151
71,744
81,944
19.2
21.7
13.4
20.1
20.2
13.5
1.7
1.6
8.4
11.3
1.5
1.2
Tata Steel
Neutral
502
-
48,721
121,374
121,856
7.2
8.4
18.6
34.3
27.0
14.6
1.7
1.5
6.1
10.1
1.0
1.0
Oil & Gas
Cairn India
Neutral
300
-
56,314
9,127
10,632
4.3
20.6
8.8
11.7
34.1
25.7
1.1
1.1
3.3
4.2
7.6
6.4
Stock Watch
April 07, 2017
Company Name
Reco
CMP
Target
Mkt Cap
Sales ( Čcr )
OPM(%)
EPS (Č)
PER(x)
P/BV(x)
RoE(%)
EV/Sales(x)
(Č)
Price ( Č)
( Č cr )
FY17E FY18E
FY17E
FY18E
FY17E
FY18E
FY17E
FY18E
FY17E
FY18E
FY17E
FY18E
FY17E
FY18E
Oil & Gas
GAIL
Neutral
387
-
65,428
56,220
65,198
9.3
10.1
27.1
33.3
14.3
11.6
1.3
1.2
9.3
10.7
1.4
1.1
ONGC
Neutral
187
-
240,238
137,222
152,563
15.0
21.8
19.5
24.1
9.6
7.8
0.8
0.8
8.5
10.1
2.0
1.8
Indian Oil Corp
Neutral
386
-
187,317
373,359
428,656
5.9
5.5
54.0
59.3
7.1
6.5
1.1
1.0
16.0
15.6
0.7
0.6
Reliance Industries
Neutral
1,438
-
467,647
301,963
358,039
12.1
12.6
87.7
101.7
16.4
14.1
1.7
1.5
10.7
11.3
2.0
1.7
Pharmaceuticals
Alembic Pharma
Accumulate
620
689
11,684
3,483
4,244
20.2
21.4
24.3
33.6
25.5
18.5
5.8
4.6
25.5
25.3
3.3
2.6
Alkem Laboratories Ltd
Neutral
2,185
-
26,127
6,065
7,009
18.7
20.0
80.2
92.0
27.3
23.8
6.1
5.1
22.5
21.6
4.3
3.7
Aurobindo Pharma
Buy
670
877
39,239
15,720
18,078
23.7
23.7
41.4
47.3
16.2
14.2
4.2
3.3
29.6
26.1
2.7
2.4
Aventis*
Neutral
4,694
-
10,811
2,277
2,597
16.6
17.4
128.9
157.0
36.4
29.9
6.2
4.8
21.6
26.4
4.5
3.8
Cadila Healthcare
Neutral
448
-
45,874
10,429
12,318
17.7
21.6
13.1
19.2
34.2
23.3
7.2
5.7
22.8
27.1
4.4
3.7
Cipla
Sell
589
465
47,378
15,378
18,089
15.7
16.8
19.3
24.5
30.5
24.0
3.6
3.2
12.3
13.9
3.2
2.7
Dr Reddy's
Neutral
2,711
-
44,918
16,043
18,119
18.0
23.0
78.6
130.9
34.5
20.7
3.4
3.0
10.1
15.2
2.6
2.5
Dishman Pharma
Sell
331
143
5,340
1,718
1,890
22.7
22.8
9.5
11.3
34.8
29.3
3.4
3.1
10.1
10.9
3.6
3.2
GSK Pharma*
Neutral
2,731
-
23,128
2,800
3,290
10.2
20.6
32.2
60.3
84.8
45.3
15.7
15.5
17.2
34.5
8.0
6.9
Indoco Remedies
Neutral
240
-
2,216
1,112
1,289
16.2
18.2
11.6
16.0
20.7
15.0
3.3
2.8
17.0
20.1
2.1
1.8
Ipca labs
Neutral
636
-
8,028
3,258
3,747
12.8
15.3
12.1
19.2
52.6
33.1
3.3
3.0
6.4
9.5
2.6
2.3
Lupin
Buy
1,448
1,809
65,395
15,912
18,644
26.4
26.7
58.1
69.3
24.9
20.9
4.9
4.0
21.4
20.9
4.2
3.4
Sun Pharma
Buy
687
847
164,707
31,129
35,258
32.0
32.9
30.2
35.3
22.7
19.5
3.7
3.1
20.0
20.1
4.9
4.1
Power
Tata Power
Neutral
87
-
23,613
36,916
39,557
17.4
27.1
5.1
6.3
17.1
13.9
1.5
1.4
9.0
10.3
1.7
1.5
NTPC
Neutral
167
-
137,905
86,605
95,545
17.5
20.8
11.8
13.4
14.2
12.5
1.4
1.3
10.5
11.1
2.9
2.9
Power Grid
Accumulate
197
223
103,167
25,315
29,193
88.2
88.7
14.2
17.2
13.9
11.5
2.1
1.9
15.2
16.1
8.7
7.8
Real Estate
Prestige Estate
Neutral
228
-
8,544
4,707
5,105
25.2
26.0
10.3
13.0
22.1
17.5
1.8
1.7
10.3
10.2
3.0
2.7
MLIFE
Buy
408
522
1,676
1,152
1,300
22.7
24.6
29.9
35.8
13.7
11.4
1.0
1.0
7.6
8.6
2.2
1.8
Telecom
Bharti Airtel
Neutral
342
-
136,571
105,086
114,808
34.5
34.7
12.2
16.4
28.0
20.8
1.9
1.8
6.8
8.4
2.2
1.9
Idea Cellular
Neutral
87
-
31,186
40,133
43,731
37.2
37.1
6.4
6.5
13.5
13.3
1.1
1.0
8.2
7.6
1.8
1.5
zOthers
Abbott India
Neutral
4,826
-
10,255
3,153
3,583
14.1
14.4
152.2
182.7
31.7
26.4
155.7
133.0
25.6
26.1
3.0
2.6
Asian Granito
Neutral
372
-
1,119
1,060
1,169
12.2
12.5
12.7
15.9
29.4
23.4
2.8
2.5
9.5
10.7
1.4
1.2
Bajaj Electricals
Accumulate
352
395
3,566
4,801
5,351
5.7
6.2
10.4
13.7
33.8
25.7
4.2
3.7
12.4
14.5
0.7
0.7
Banco Products (India)
Neutral
225
-
1,611
1,353
1,471
12.3
12.4
14.5
16.3
15.5
13.8
21.5
19.3
14.5
14.6
1.1
121.6
Coffee Day Enterprises
Neutral
234
-
4,812
2,964
3,260
20.5
21.2
4.7
8.0
-
29.2
2.7
2.5
5.5
8.5
2.0
1.8
Ltd
Stock Watch
April 07, 2017
Company Name
Reco
CMP
Target
Mkt Cap
Sales ( Čcr )
OPM(%)
EPS (Č)
PER(x)
P/BV(x)
RoE(%)
EV/Sales(x)
(Č)
Price ( Č)
( Č cr )
FY17E
FY18E
FY17E
FY18E
FY17E
FY18E
FY17E
FY18E
FY17E
FY18E
FY17E
FY18E
FY17E
FY18E
zOthers
Competent Automobiles Neutral
227
-
140
1,137
1,256
3.1
2.7
28.0
23.6
8.1
9.6
43.7
39.5
14.3
11.5
0.1
0.1
Elecon Engineering
Neutral
57
-
643
1,482
1,660
13.7
14.5
3.9
5.8
14.7
9.9
3.5
3.2
7.8
10.9
0.8
0.7
Finolex Cables
Neutral
531
-
8,125
2,883
3,115
12.0
12.1
14.2
18.6
37.4
28.6
19.9
17.4
15.8
14.6
2.5
2.3
Garware Wall Ropes
Neutral
719
-
1,573
863
928
15.1
15.2
36.4
39.4
19.8
18.3
3.6
3.1
17.5
15.9
1.7
1.6
Goodyear India*
Neutral
900
-
2,075
1,598
1,704
10.4
10.2
49.4
52.6
18.2
17.1
84.1
73.8
18.2
17.0
1.0
140.6
Hitachi
Neutral
1,793
-
4,875
2,081
2,433
8.8
8.9
33.4
39.9
53.7
44.9
43.3
36.1
22.1
21.4
2.3
2.0
HSIL
Neutral
353
-
2,550
2,384
2,515
15.8
16.3
15.3
19.4
23.1
18.2
22.9
19.7
7.8
9.3
1.2
1.1
Interglobe Aviation
Neutral
1,050
-
37,961
21,122
26,005
14.5
27.6
110.7
132.1
9.5
8.0
56.8
40.6
168.5
201.1
1.8
1.4
Jyothy Laboratories
Neutral
348
-
6,323
1,440
2,052
11.5
13.0
8.5
10.0
40.9
34.8
9.9
9.2
18.6
19.3
4.7
3.3
Kirloskar Engines India
Neutral
391
-
5,648
2,554
2,800
9.9
10.0
10.5
12.1
37.2
32.3
15.6
14.7
10.7
11.7
1.9
1.7
Ltd
Linc Pen & Plastics
Neutral
292
-
432
382
420
9.3
9.5
13.5
15.7
21.7
18.6
3.7
3.2
17.1
17.3
1.2
1.1
M M Forgings
Neutral
557
-
672
546
608
20.4
20.7
41.3
48.7
13.5
11.4
76.3
67.5
16.6
17.0
1.1
1.0
Manpasand Bever.
Neutral
708
-
4,048
836
1,087
19.6
19.4
16.9
23.8
41.9
29.7
5.0
4.4
12.0
14.8
4.6
3.4
Mirza International
Buy
89
107
1,066
963
1,069
17.2
18.0
6.1
7.5
14.5
11.8
2.2
1.9
15.0
15.7
1.3
1.2
MT Educare
Neutral
85
-
337
366
417
17.7
18.2
9.4
10.8
9.0
7.8
2.0
1.7
22.2
22.3
0.8
0.7
Narayana Hrudaya
Neutral
319
-
6,512
1,873
2,166
11.5
11.7
2.6
4.0
120.5
80.4
7.4
6.7
6.1
8.3
3.6
3.1
Navkar Corporation
Buy
208
265
2,972
369
561
42.9
42.3
6.9
11.5
30.2
18.1
2.1
1.9
7.4
10.5
9.1
6.0
Navneet Education
Neutral
167
-
3,892
1,062
1,147
24.0
24.0
6.1
6.6
27.4
25.2
5.6
5.0
20.6
19.8
3.7
3.5
Nilkamal
Neutral
2,056
-
3,068
1,995
2,165
10.7
10.4
69.8
80.6
29.5
25.5
117.5
102.1
16.6
16.5
1.5
1.4
Page Industries
Neutral
14,460
-
16,129
2,450
3,124
20.1
17.6
299.0
310.0
48.4
46.7
322.1
245.8
47.1
87.5
6.6
5.2
Parag Milk Foods
Neutral
240
-
2,021
1,919
2,231
9.3
9.6
9.5
12.9
25.4
18.6
4.0
3.3
15.5
17.5
1.2
1.0
Quick Heal
Neutral
247
-
1,735
408
495
27.3
27.0
7.7
8.8
32.0
28.1
3.0
3.0
9.3
10.6
3.4
2.8
Radico Khaitan
Accumulate
128
147
1,702
1,667
1,824
13.0
13.2
6.7
8.2
19.2
15.6
1.7
1.6
9.0
10.2
1.4
1.3
Relaxo Footwears
Neutral
490
-
5,886
2,085
2,469
9.2
8.2
7.6
8.0
64.8
61.7
25.1
21.5
17.9
18.8
2.9
2.5
S H Kelkar & Co.
Neutral
303
-
4,375
1,036
1,160
15.1
15.0
6.1
7.2
49.5
42.1
5.3
4.9
10.7
11.5
4.1
3.6
Siyaram Silk Mills
Accumulate
1,710
1,872
1,603
1,652
1,857
11.6
11.7
92.4
110.1
18.5
15.5
2.7
2.4
14.7
15.2
1.2
1.0
Styrolution ABS India*
Neutral
723
-
1,271
1,440
1,537
9.2
9.0
40.6
42.6
17.8
17.0
45.5
41.3
12.3
11.6
0.8
0.7
Surya Roshni
Neutral
209
-
918
3,342
3,625
7.8
7.5
17.3
19.8
12.1
10.6
23.0
18.5
10.5
10.8
0.5
0.5
Team Lease Serv.
Neutral
1,005
-
1,718
3,229
4,001
1.5
1.8
22.8
32.8
44.1
30.6
4.7
4.1
10.7
13.4
0.4
0.3
Stock Watch
April 07, 2017
Company Name
Reco
CMP
Target Mkt Cap
Sales ( Čcr )
OPM(%)
EPS (Č)
PER(x)
P/BV(x)
RoE(%)
EV/Sales(x)
(Č)
Price ( Č)
( Č cr )
FY17E FY18E FY17E FY18E FY17E FY18E FY17E FY18E FY17E FY18E FY17E FY18E FY17E FY18E
zOthers
The Byke Hospitality
Neutral
183
-
734
287
384
20.5
20.5
7.6
10.7
24.1
17.1
5.0
4.1
20.7
23.5
2.6
1.9
Transport Corporation of
Neutral
235
-
1,796
2,671
2,911
8.5
8.8
13.9
15.7
16.9
15.0
2.3
2.1
13.7
13.8
0.8
0.7
India
TVS Srichakra
Neutral
3,517
-
2,693
2,304
2,614
13.7
13.8
231.1
266.6
15.2
13.2
395.1
311.1
33.9
29.3
1.2
1.0
UFO Moviez
Neutral
451
-
1,245
619
685
33.2
33.4
30.0
34.9
15.1
12.9
2.1
1.8
13.8
13.9
1.7
1.4
Visaka Industries
Neutral
320
-
509
1,051
1,138
10.3
10.4
21.0
23.1
15.3
13.8
41.1
38.5
9.0
9.2
0.7
0.7
VRL Logistics
Neutral
347
-
3,163
1,902
2,119
16.7
16.6
14.6
16.8
23.8
20.6
5.2
4.6
21.9
22.2
1.8
1.6
VIP Industries
Neutral
205
-
2,890
1,270
1,450
10.4
10.4
5.6
6.5
36.5
31.5
7.6
6.6
20.7
21.1
2.3
2.0
Navin Fluorine
Buy
3,163
3,650
3,097
789
945
21.1
22.4
120.1
143.4
26.3
22.1
4.2
3.7
17.8
18.5
3.9
3.1
Source: Company, Angel Research; Note: *December year end; #September year end; &October year end; Price as on April 06, 2017
Market Outlook
April 07, 2017
Research Team Tel: 022 - 39357800
DISCLAIMER
Angel Broking Private Limited (hereinafter referred to as “Angel”) is a registered Member of National Stock Exchange of India
Limited,Bombay Stock Exchange Limited and Metropolitan Stock Exchange Limited. It is also registered as a Depository Participant with
CDSL and Portfolio Manager with SEBI. It also has registration with AMFI as a Mutual Fund Distributor. Angel Broking Private Limited is a
registered entity with SEBI for Research Analyst in terms of SEBI (Research Analyst) Regulations, 2014 vide registration number
INH000000164. Angel or its associates has not been debarred/ suspended by SEBI or any other regulatory authority for accessing
/dealing in securities Market. Angel or its associates/analyst has not received any compensation / managed or
co-managed public offering of securities of the company covered by Analyst during the past twelve months.
This document is solely for the personal information of the recipient, and must not be singularly used as the basis of any investment
decision. Nothing in this document should be construed as investment or financial advice. Each recipient of this document should make
such investigations as they deem necessary to arrive at an independent evaluation of an investment in the securities of the companies
referred to in this document (including the merits and risks involved), and should consult their own advisors to determine the merits and
risks of such an investment.
Reports based on technical and derivative analysis center on studying charts of a stock's price movement, outstanding positions and
trading volume, as opposed to focusing on a company's fundamentals and, as such, may not match with a report on a company's
fundamentals. Investors are advised to refer the Fundamental and Technical Research Reports available on our website to evaluate the
contrary view, if any.
The information in this document has been printed on the basis of publicly available information, internal data and other reliable
sources believed to be true, but we do not represent that it is accurate or complete and it should not be relied on as such, as this
document is for general guidance only. Angel Broking Pvt. Limited or any of its affiliates/ group companies shall not be in any way
responsible for any loss or damage that may arise to any person from any inadvertent error in the information contained in this report.
Angel Broking Pvt. Limited has not independently verified all the information contained within this document. Accordingly, we cannot
testify, nor make any representation or warranty, express or implied, to the accuracy, contents or data contained within this document.
While Angel Broking Pvt. Limited endeavors to update on a reasonable basis the information discussed in this material, there may be
regulatory, compliance, or other reasons that prevent us from doing so.
This document is being supplied to you solely for your information, and its contents, information or data may not be reproduced,
redistributed or passed on, directly or indirectly.
Neither Angel Broking Pvt. Limited, nor its directors, employees or affiliates shall be liable for any loss or damage that may arise from
or in connection with the use of this information.